The Singapore Property Price Index tells us how the Singapore Property Market is performing. It is a reflection on the supply and demand of properties in Singapore. Below are 5 different charts depending on the data you require. Scroll below to see how each data can help you.
Overall Private Property Price Index
Overall Private Property Price Index – Use to see the trend of Singapore market, whether you should enter the market.
Go to website to see past 10 years or 25 years range.
Private Property Price Index (By Region)
Private Property Price Index by Region – The first chart for overall Singapore Price Index is split into 3 regions and is use to determine which area is best to invest in.
Private Property Price Index (Landed vs Non-Landed)
Private Property Price Index of Landed vs Non-Landed – To determine which is more in demand and better for investment.
Commercial Property Price Index (Office VS Retail)
HDB Resale Price Index
HDB Price Index – You can use this with the above Private Property Price Index Chart to determine whether it’s better to go for a private or HDB.
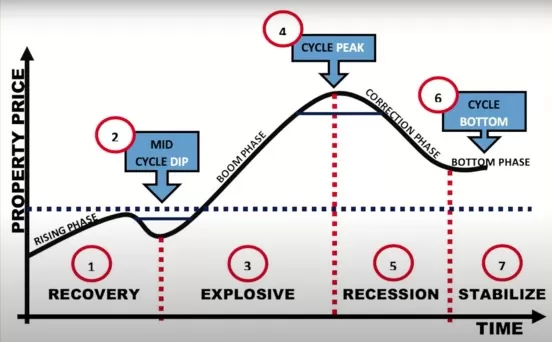
Picture above is a reference to the 4 Stages of Property Market Cycle.
Understanding where we are at now in the Market Cycle will enable investors to know when the best time to enter the Market.